Be.Smart Site Management
  • â„šī¸What is Be.Smart Site Management?
  • âš™ī¸Requirements
  • 💾Supported file formats
  • 🆕What's new ?
    • Q1/2023 Release
    • Q2/2023 Release
    • Q3/2023 Release
    • Q1/2024 Release
  • Getting started
    • Project set up in Trimble Connect
      • Create a project to Trimble Connect
        • Create a blank project (Trimble Connect)
        • Create a project based on template
      • User management in Trimble Connect environment
      • Project settings in Trimble Connect
    • Project set up in Autodesk Construction Cloud
      • Create a project to ACC
        • Create a blank project (ACC)
      • User management in ACC environment
    • Project set up in Site Management
      • Site Management - Project configuration
        • Coordinate reference system
        • Project location
        • Toggles
        • Coordinate formatting
        • AIS marine traffic
        • Application background maps
        • Background maps
        • Overlay maps
        • Default background map
        • Default models
        • Project links
        • Connections
        • Permissions and Metadata
      • Settings for Site Management
  • Site Management
    • Project interface
      • Toolbar
      • Project tree
      • Map interface
    • 📐Measurement tool
    • 📈Elevation tool
    • âœ‚ī¸Section tool
      • How to create a section
      • Measurements in sections
      • Breaklines in section
      • Print tool in a section
    • đŸ–¨ī¸Print tool
      • Print tool options
    • 📏Inspect breaklines
    • âœī¸Markings
      • Creating a marking
      • Editing a marking
      • Inspect markings
      • Filtering markings
      • Use-cases for markings
    • 📸Presets
      • Creating a preset
      • Open a preset
    • đŸ—ēī¸Map layers
    • đŸŽĨ3D viewers
  • Integrations and extensions
    • GeoView -integration
    • Pointscene -integration
      • Define the calculation type
      • Select the point cloud
      • Select the LandXML -file
      • Defining the boundary
      • Visualization
      • Results
    • Utilization -extension
      • Utilization report
    • Machine Control -extension
      • Novatron/MOBA Xsite Manage
      • Topcon Sitelink 3D v2
Powered by GitBook
On this page
  • Numeric values
  • Reconfiguring visualization
  1. Integrations and extensions
  2. Pointscene -integration

Results

PreviousVisualizationNextUtilization -extension

The volume calculation is presented in the map interface, based on the coloring and clicking the colored area will display the results in numeric format.

Please note that the visualization can be changed.

Results are stored only for the on-going session, these cannot be saved.

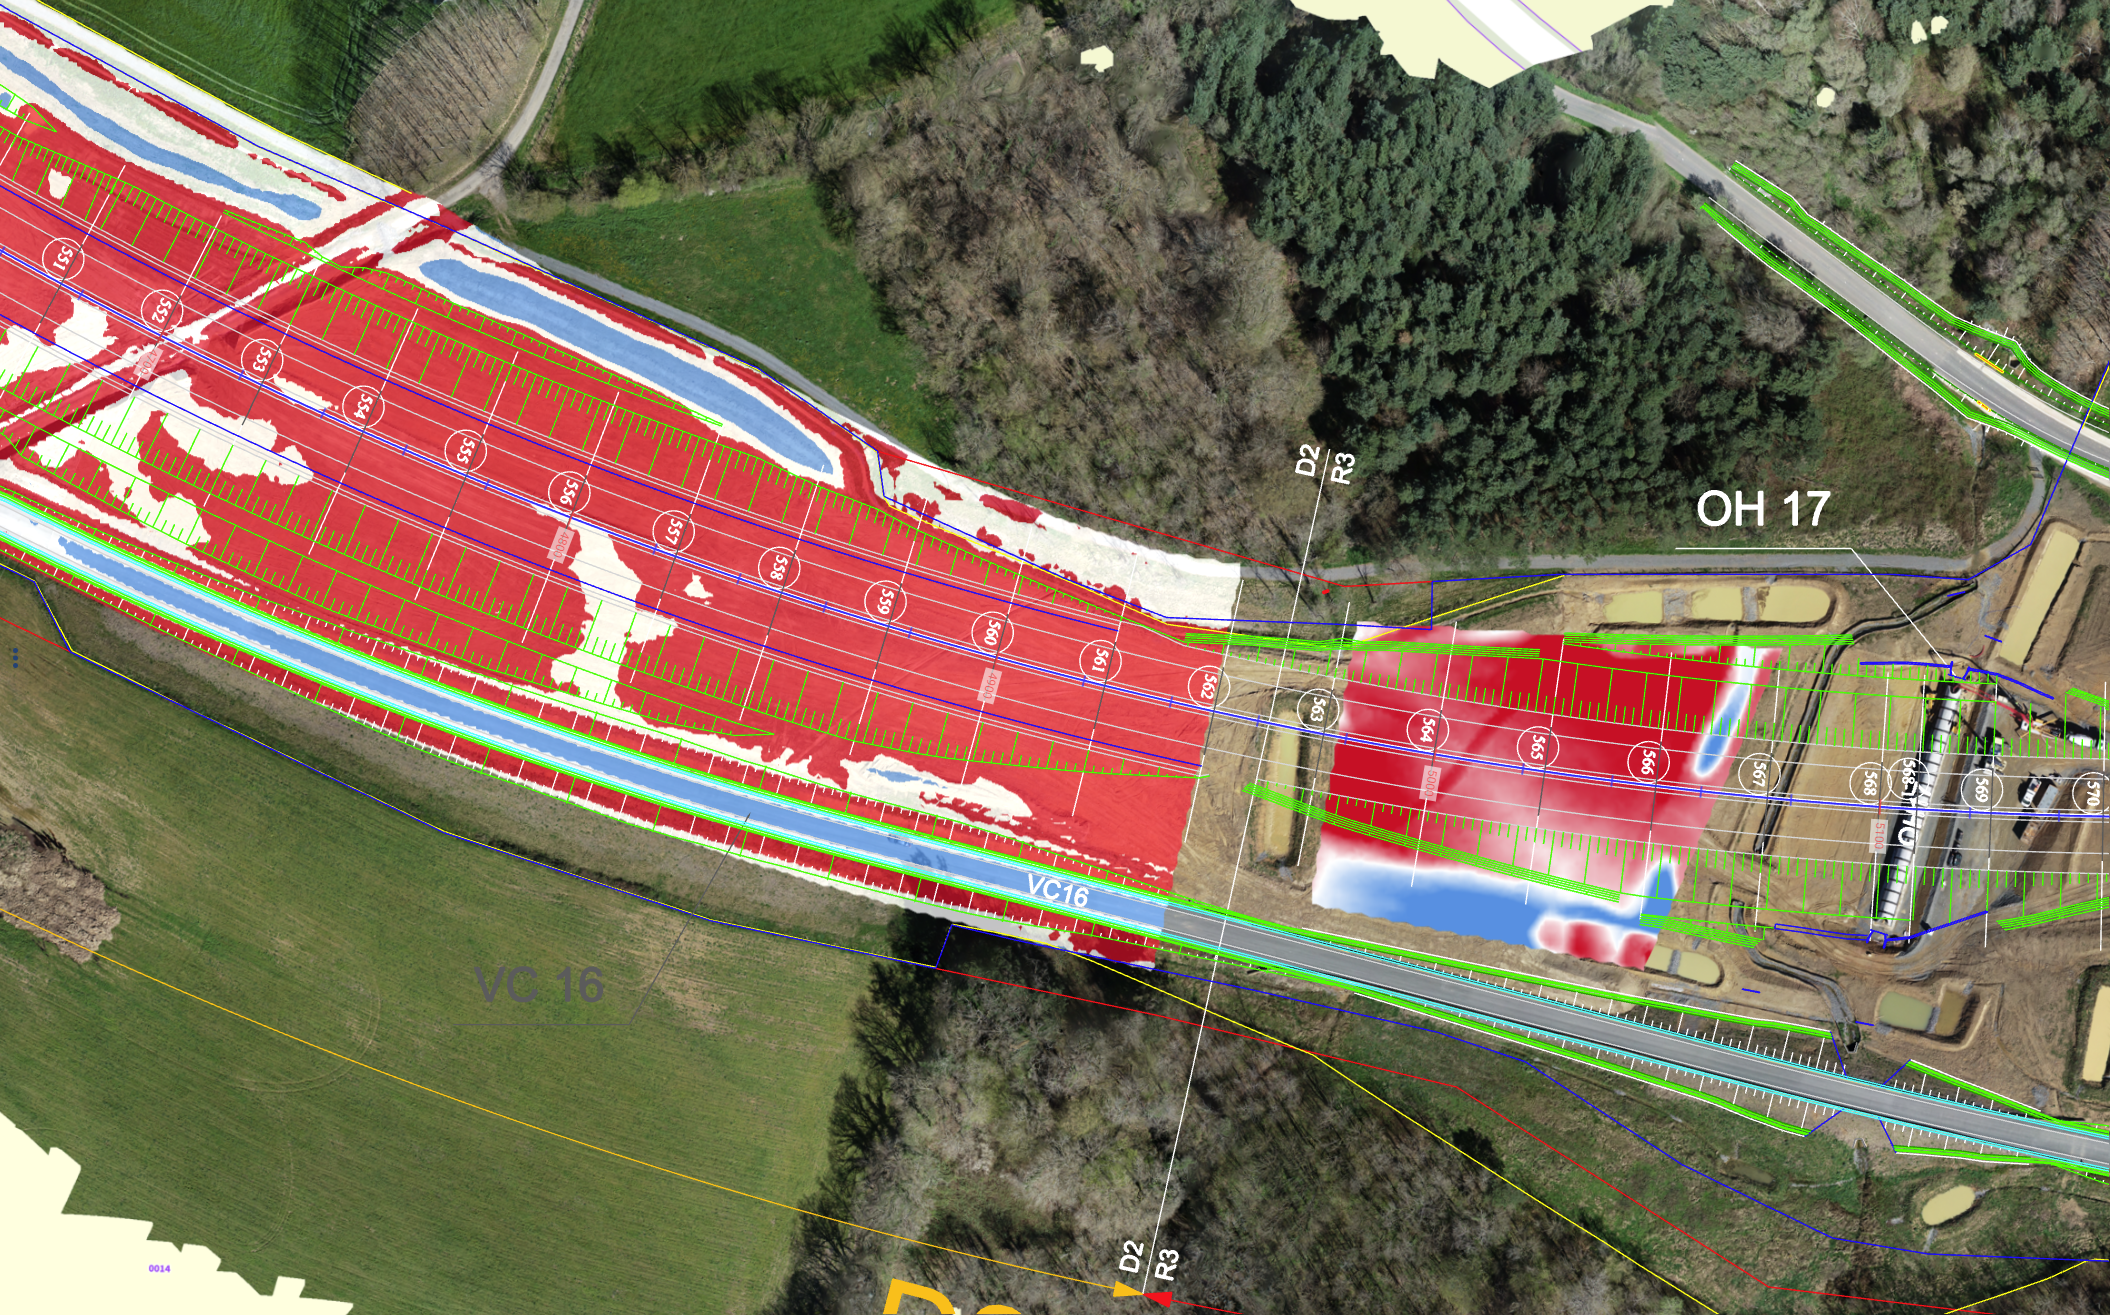
The picture above shows both coloring modes. The larger area on the left is with the second option (cut-zero-fill) and the smaller area on the right is color gradient.

Notice the difference that the left side is either blue, red or white. The area on the right side has more shades of red and blue.

Numeric values

The calculation also returns the exact numeric values of cut, fill, net volume and area.

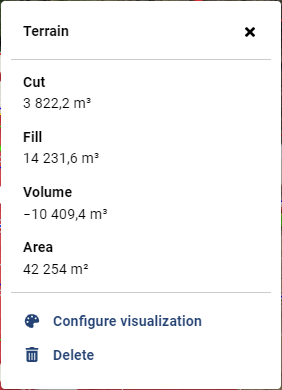
By clicking the visualization it opens a pop-up, which has the exact values between the point cloud and the surface.

The Volume -value is calculated by subtracting Fill -value from the Cut -value. If the value is negative, it means that there is need for material in this area. If the value is positive, it means that there are excess material.

Reconfiguring visualization

The visualization can be reconfigured, meaning that all the settings can be changed.

This is very useful way of getting familiar with the different coloring modes and how the change in values impact the results.

Volume calculation results
Numeric values