Data Matrix
Command Description

This command can convert text or numeric data (static or an iProperty value) to a Data Matrix, which is a two-dimensional code consisting of black and white dots arranged in a square or rectangular pattern. To convert values to data matrices, the DataMatrix.net library is used.
Similar to QR codes, the data matrix is machine-readable and can contain error correction data in case the data matrix gets dirty or damaged. Compared to QR codes, the data matrices can store less information, but thanks to their smaller physical size, they are suitable for individual parts marking (e.g., components of electronic devices).

Command Location
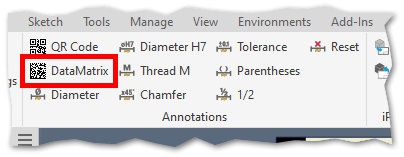
Drawing environment (
Be.Smart T4I -> Annotations)Drawing environment (
Annotate -> Symbols)Data matrix iProperties can be defined in all document types.
Command Settings
Be.Smart T4I -> Be.Smart T4I -> Edit settings -> QR code tools.
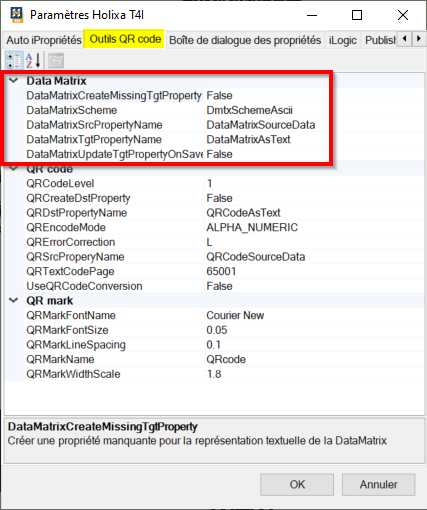
Be.Smart T4I -> Be.Smart T4I -> Advanced settings -> QR code tools (the advanced settings window)


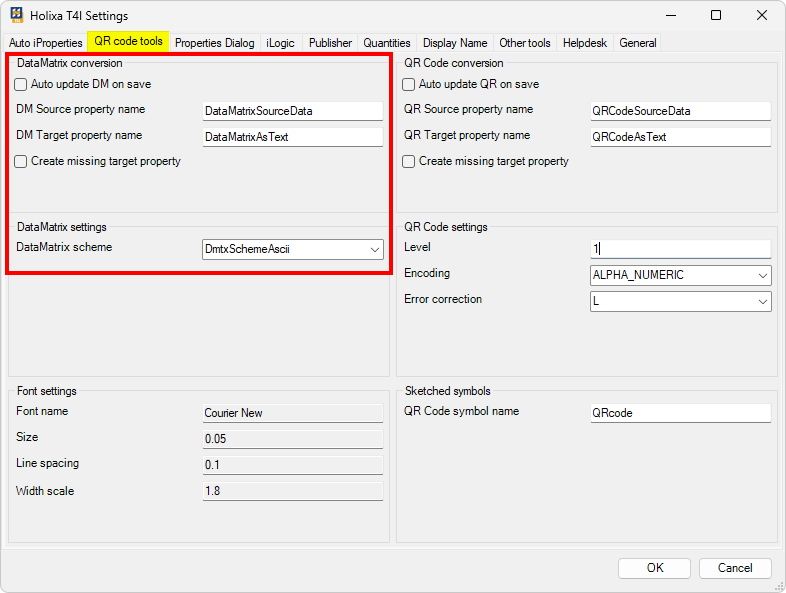
DataMatrix conversion (the basic settings window)
This section is valid for automatic iProperty to Data Matrix conversion.
Auto update DM on save
Data matrix value can be automatically updated when saving the document. That does not apply to data matrices with static text.
DM Source property name / DM Target property name
DM Source property name defines the name of the iProperty that will contain the value (mostly of some iProperty) that is to be translated into a data matrix.
DM Target property name defines the name of the iProperty that will contain the DM's textual representation of the value converted from the source DM property.
Create missing target property
If checked, the target property containing the converted source property value can be created automatically after saving the document. On the other hand, the source property has to be created manually beforehand, because it is not known in advance what value it will contain.
DataMatrix settings (the basic settings window)
DataMatrix scheme
Different encoding schemes determine how much data can fit into a given data matrix symbol. Proper scheme selection is essential in achieving the best ratio of stored data amount and symbol size. The default ASCII encoding is the most used encoding scheme.
DmtxSchemeAscii
Double digit numerics, ASCII 0-127, Extended ASCII 128-255
DmtxSchemeC40
Primarily upper-case alphanumeric
DmtxSchemeText
Primarily lower-case alphanumeric
DmtxSchemeX12
ANSI X12 EDI data set
DmtxSchemeEdifact
ASCII values 32-94
DmtxSchemeBase256
All byte values 0-255
DmtxSchemeAsciiGS1
ISO/IEC 646 subset (equivalent to ASCII 256 table)
DmtxSchemeAutoFast
not implemented yet
DmtxSchemeAutoBest
not implemented yet
Font settings
To ensure data matrices from automatically converted iProperties are correctly visible and readable, the correct font settings must be used. The default font settings are carefully selected so the data matrix is displayed correctly.
Generally, the data matrix font settings must be changed cautiously. Therefore, in the basic Holixa T4I settings window, the font settings values are set to read-only. If necessary, the font settings can be changed in the advanced settings window.
Other font settings for good data matrix visibility in the drawing may be as follows:
Size=0.5
Line spacing=1
Width scale=1.8
Workflow Overview And Examples
The manual data matrix insertion is done using the command in the drawing environment. On the other hand, the automatic iProperty conversion is prepared using the ordinary iProperty manipulation workflows.
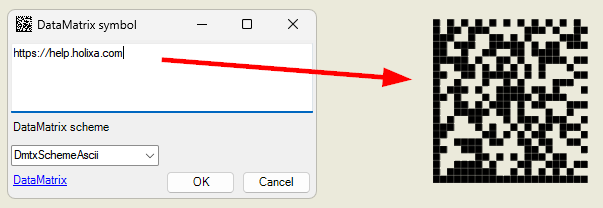
Static text conversion (manual conversion to data matrix)
Run the command.
Enter the text to be converted.
Select the DataMatrix scheme.
Confirm with OK.
Move the data matrix from the initial position (bottom left corner of the drawing) to the final position.

iProperty value conversion
Create the custom source iProperty DataMatrixSourceData (or use any other suitable name).
Assign the iProperty to the source property using the syntax =<iProperty Name> or enter a static value.
Save the file. If allowed in settings, the target iProperty (e.g. DataMatrixAsText) should be created. Otherwise, create the target iProperty manually first.
In a drawing, create a text annotation mapped to the model target iProperty. Don't forget to apply proper font formatting.
You can have your drawing template adjusted beforehand so the data matrix can be displayed, e.g., in a drawing title block.
